IPL 2027 champion forecast — report
All numbers below come from python run.py (full tables: outputs/results.md).
Data cutoff: 2026-05-01 (match 43 of the 2026 league stage). This is a conditional, pre-tournament
forecast. Read the limitations before you quote any single team's number.
1. Dataset quality and limitations
| File | Rows | Content |
|---|---|---|
ipl_matches_data.csv | 1,212 | one row per match, 2008-04-18 → 2026-05-01 |
ball_by_ball_data.csv | 288,226 | every delivery of every match (0 missing matches, 0 duplicate deliveries) |
players-data-updated.csv | 799 | player name, batting/bowling style (no team, no dates) |
teams_data.csv, team_aliases.csv | 16 / 46 | team ids and alias spellings |
Checks and fixes:
- Deccan Chargers are merged into Sunrisers Hyderabad. The alias table gives both franchises team_id 2. SRH was a new franchise in 2013, so the code splits them: id 2 up to 2012 is DCH, from 2013 it is SRH. Delhi Daredevils→Capitals and Kings XI→Punjab Kings are the same franchise under a new name, and stay merged.
- No-result rows have a fake winner.
match_winneris filled in for all 9 no-results, mostly withteam2. Those rows are excluded from training, evaluation and Elo. - Ties (16) carry the super-over winner, which is the official result. Elo updates them as draws.
team1is post-toss information. It is the side batting first 75.2% of the time. Each match's two teams are therefore ordered alphabetically, never byteam1.- Missing matches. Matches abandoned without a toss are absent (e.g. 71 rows for 2024). A few no-results are known to be missing from the points tables.
- Smaller gaps. 59 venue spellings for about 40 grounds; 51 missing cities (all in the UAE);
win_by_runsagrees with ball-by-ball totals in 97.8% of matches (the rest look like rain-shortened games). - Playoffs are the rows with no
match_number: 3 per season in 2008–09, 4 afterwards. The champions derived from the data match the historical record (tested for 2009 and 2025). - Format changes: 8 teams (2008–10, 2014–21), 10 teams (2011, 2022–26), 9 teams (2012–13). Semi-finals until 2010, the Qualifier/Eliminator format since 2011.
Not in the data: 2026 results after 1 May, the 2026 champion, any squad or retention/auction information, the 2027 squads, schedule, groups or rules, injuries or availability, and player-to-team mappings outside matches already played.
2. Prediction problem and models
There are three separate problems:
- Match outcome: P(A beats B) for one fixture.
- Qualification: P(top 4 after the league stage).
- Champion: P(winning the playoffs).
The 2027 question is a pre-tournament problem. Nothing from 2027 is observed, so the champion probability comes from simulating whole seasons, not from a classifier.
| Model | Role | Why |
|---|---|---|
| Coin flip (0.5), shrunk career win % (log5) | baselines | what any model must beat |
| Elo (K, between-season carry-over and home advantage tuned on past seasons only) | match model and team strength | few parameters, handles franchise entry/exit, works across eras |
| Logistic regression (Elo diff, rolling run-rate diff, rolling form, home) | challenger | tests whether ball-by-ball team stats add signal |
| Gradient boosting (sklearn HistGBM, shallow, fixed settings) | challenger | standard nonlinear model. XGBoost/LightGBM weren't installed and the disk had ~200 MB free; with about 1,000 training rows they wouldn't change the conclusion |
| Pre-season strength model + Monte Carlo | tournament | θ_team ~ N(1500 + shrink·(Elo_start − 1500), τ²), drawn once per simulated season |
shrink and τ are fitted by Monte Carlo marginal likelihood of whole past seasons. The simulation then averages over the full (shrink, τ) posterior instead of plugging in one estimate.
An ensemble (Elo+LR average) was tested and rejected (Section 4).
Leakage controls
- Rolling-origin backtest: for test season S, every hyperparameter and model weight uses seasons up to S−1 only.
- Rolling features use
shift(1), so a match's features see only that team's earlier matches. A unit test confirms that changing a match's own result doesn't change its features. - Toss and playing XIs are never used in the main models. Toss appears only in one clearly labelled post-toss variant.
- Pre-tournament forecasts are frozen at season start; only the published fixture list is used, never results.
3. Historical backtests (out of sample)
Match level (pre-match and pre-toss; in-season Elo updating; 882 matches from 2013–2026):
| model | log loss | Brier | AUC | accuracy |
|---|---|---|---|---|
| coin flip | 0.6931 | 0.2500 | — | — |
| win % (log5) | 0.6966 | 0.2516 | 0.532 | 52.6% |
| Elo | 0.6942 | 0.2505 | 0.527 | 50.9% |
| logistic regression | 0.6988 | 0.2527 | 0.516 | 49.8% |
| gradient boosting | 0.7188 | 0.2622 | 0.482 | 49.1% |
| Elo + LR ensemble | 0.6960 | 0.2514 | 0.518 | 50.6% |
| LR + toss (post-toss) | 0.6985 | 0.2525 | 0.520 | 51.8% |
Paired bootstrap of the log-loss difference (95% interval):
- Elo − coin: +0.0010 [−0.0069, +0.0098], no detectable difference.
- LR − Elo: +0.0046 [+0.0003, +0.0088], LR is worse.
- GBM − Elo: +0.0247 [+0.0123, +0.0373], GBM overfits.
- The toss adds nothing: −0.0003 [−0.0021, +0.0016].
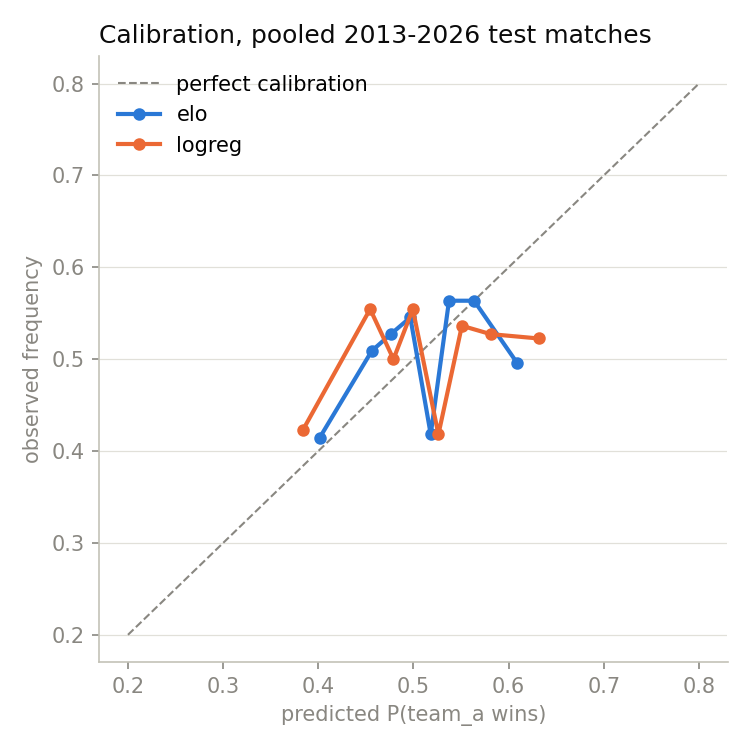
Calibration (outputs/calibration.png): predictions sit between 0.38 and 0.63, and the observed rates in each bin are noisy around 0.5.
Pre-tournament level (frozen at season start; 830 league matches): log loss 0.6952 vs 0.6931 for a coin flip.
Tournament level: pre-season title probabilities for 2013–2025, using the real fixtures and playoff formats, scored on the log probability given to the actual champion.
| period | seasons | model mean log p(champion) | uniform | model beats uniform | playoff Brier (model / uniform) |
|---|---|---|---|---|---|
| 2013–2021 | 9 | −1.781 | −2.093 | 7 of 9 | 0.233 / 0.250 |
| 2022–2025 | 4 | −2.536 | −2.303 | 1 of 4 | 0.270 / 0.240 |
| all | 13 | −2.013 | −2.157 | 8 of 13 | 0.245 / 0.247 |
Before 2022 the model gained real ground on uniform, because CSK and MI were persistently strong. Since the 2022 expansion and the 2022/2025 mega-auctions, prior ratings have been worse than uniform: champions GT 2022, KKR 2024 and RCB 2025 were ranked 5th, 9th and 10th pre-season.
4. Comparison with baselines and model choice
No match model beats a coin flip with any statistical confidence. IPL match outcomes are close to a coin toss given team-level history. Elo is kept because:
- it is the best non-trivial model, statistically tied with the coin;
- it beats LR, GBM and the ensemble;
- it supplies the strength scale the simulator needs.
The extra features (run-rate differential, form) carry no out-of-sample signal: the form coefficient is even slightly negative. The ensemble is rejected (+0.0018 log loss vs Elo).
5–7. IPL 2027 forecast (20,000 simulated seasons)
| rank | team | P(top 4) | P(final) | P(champion) |
|---|---|---|---|---|
| 1 | Royal Challengers Bengaluru | 45.9% | 24.5% | 12.9% |
| 2 | Gujarat Titans | 46.0% | 24.4% | 12.2% |
| 3 | Punjab Kings | 42.5% | 21.5% | 11.0% |
| 4 | Kolkata Knight Riders | 38.2% | 18.9% | 9.9% |
| 5 | Sunrisers Hyderabad | 39.3% | 19.4% | 9.8% |
| 6 | Rajasthan Royals | 39.7% | 19.8% | 9.5% |
| 7 | Delhi Capitals | 38.4% | 18.5% | 9.1% |
| 8 | Lucknow Super Giants | 38.0% | 18.4% | 8.9% |
| 9 | Chennai Super Kings | 36.8% | 17.8% | 8.4% |
| 10 | Mumbai Indians | 35.3% | 16.8% | 8.2% |
- Champion probabilities sum to 100.0%, top-4 to 400% and final to 200% (asserted in the tests).
- The Monte Carlo standard error is about 0.24 percentage points.
- Chart: outputs/ipl2027_champion_probabilities.png.
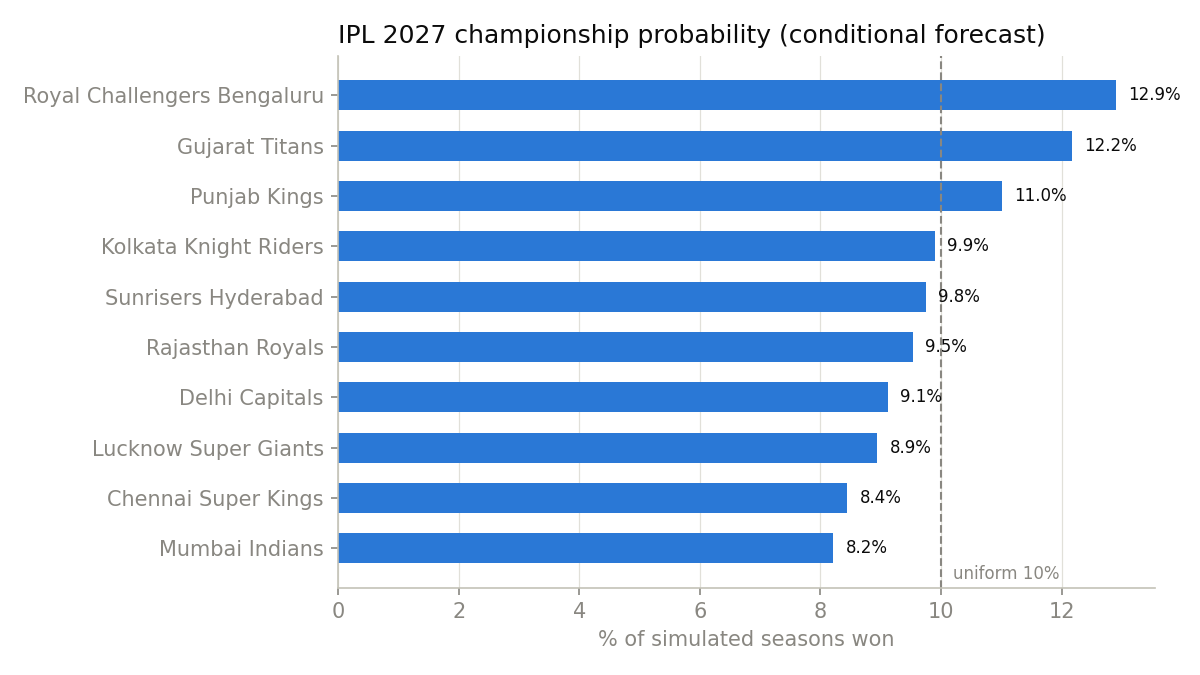
How to read it: every team is between 8% and 13%, against 10% for picking at random. Neighbouring teams in this ranking (e.g. ranks 4–8, 9.9% vs 8.9%) are not meaningfully different. Given the 2022–25 backtest, even the gap between RCB and MI should be treated as weak evidence.
8. Key factors driving the estimates
- End-of-data Elo ratings. These cover all of 2025 plus 2026 up to match 43. RCB (2025 champion), GT and PBKS (2025 finalist) rate highest; MI and CSK rate lowest.
- Between-season regression (Elo carry-over 0.8, with the shrink posterior spread over 0.25–2.0). This pulls everyone toward the mean.
- Strength uncertainty τ. The posterior favours small τ (0–25 Elo points), but the data barely separate the values. Raising τ to 150 compresses the title range to about 9.0–11.7% (tau sensitivity table).
- Small effects: home advantage of 20 Elo points (the home team won 52.7% of 846 home matches) and the playoff format (top-2 finishers get two chances to reach the final).
9. Limitations and uncertainty
- Squads are the main unknown. Team-level Elo can't see retentions, the auction or injuries. That is the most likely reason the 2022–25 tournament backtest underperformed uniform.
- The 2026 season is incomplete (43 matches, ending 1 May 2026). The rest of 2026 and its champion happened in reality but are not in the dataset and were not invented.
- The 2027 format is assumed: the 2022–26 format, i.e. 10 teams, 14 league matches each, two groups (drawn at random in every simulation) and the Qualifier/Eliminator playoffs.
- Simplifications in the simulator. NRR is approximated by simulated margins. Rain no-results (worth 1 point each) are not simulated. Venues are home/away by fixture, with no ground-specific effects.
- Small samples. There are 13 tournament backtests, and the 9 seasons from 2013 to 2021 come from a different, dynasty-dominated era. The tournament-level skill estimate is very uncertain.
- The home-city map is static and hand-entered from public knowledge (e.g. it treats 2022 Mumbai games as MI home games).
10. Exact assumptions
- Data cutoff: 2026-05-01. All matches up to that date are used; no external data.
- Teams: the 10 franchises of 2026 (CSK, DC, GT, KKR, LSG, MI, PBKS, RCB, RR, SRH), assumed unchanged for 2027.
- Final Elo: K = 4, carry = 0.8 and home = 20, all selected on 2009–2026. One season-boundary regression step is applied from the mid-2026 ratings.
- Strength model: a posterior mixture over shrink ∈ {0.25…2.0} and τ ∈ {0…150}, fitted on 2010–2026 league results.
- Simulation: 20,000 seasons over 20 random group draws. Seeds are fixed, so the results reproduce exactly.
To make this a credible forecast, re-run once the 2027 squads exist (after retentions and the auction). The highest-value upgrade is player-level strength (ratings built from the ball-by-ball data and aggregated over each 2027 squad) to replace team-level carry-over. The full 2026 results should be added as soon as they are in the dataset.