IPL 2027 batting predictions — 20 shortlisted batters
A separate analysis from the IPL 2027 champion forecast; it shares only the raw data files. Generated by python run_batting.py. Data cutoff: last match in the data (IPL 2026 is partial: 43 matches).
These are model estimates, not facts. No 2027 squads, teams, batting orders, fitness or schedule exist in the data. Expected innings come from each player's own history of playing time (including missed seasons), so the forecast does not assume every player plays the full tournament.
A. Main predictions
| Rank | Batter | Expected Runs | Lower Estimate | Upper Estimate | Expected Innings | Expected Average | Expected Strike Rate | Confidence |
|---|---|---|---|---|---|---|---|---|
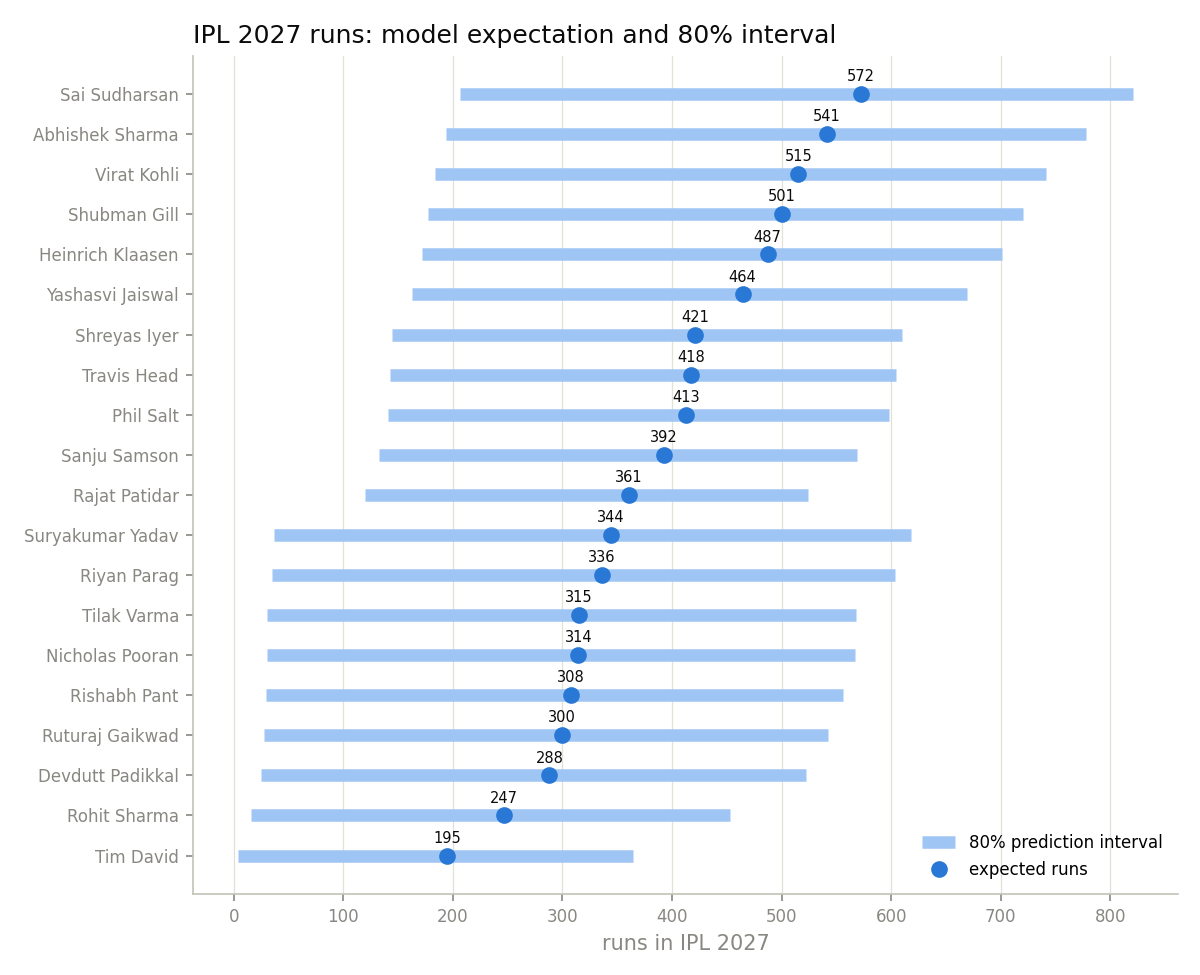
| 1 | Sai Sudharsan | 572 | 207 | 820 | 14.3 | 42.7 | 153.3 | High |
| 2 | Abhishek Sharma | 541 | 194 | 777 | 14.7 | 39.6 | 200.9 | High |
| 3 | Virat Kohli | 515 | 183 | 741 | 13.5 | 48.2 | 153.1 | High |
| 4 | Shubman Gill | 501 | 177 | 720 | 13.1 | 42.1 | 153.4 | High |
| 5 | Heinrich Klaasen | 487 | 172 | 702 | 14.7 | 41.2 | 165.6 | High |
| 6 | Yashasvi Jaiswal | 464 | 162 | 670 | 13.1 | 40.3 | 158.1 | High |
| 7 | Shreyas Iyer | 421 | 145 | 610 | 13.3 | 45.5 | 167.4 | High |
| 8 | Travis Head | 418 | 143 | 604 | 12.7 | 34.1 | 171.9 | High |
| 9 | Phil Salt | 413 | 141 | 598 | 11.5 | 38.7 | 174.7 | Medium |
| 10 | Sanju Samson | 392 | 133 | 569 | 11.8 | 42.6 | 154.5 | Medium |
| 11 | Rajat Patidar | 361 | 120 | 524 | 12.4 | 31.5 | 169.8 | High |
| 12 | Suryakumar Yadav | 344 | 37 | 618 | 11.8 | 35.1 | 161.9 | High |
| 13 | Riyan Parag | 336 | 35 | 603 | 12.1 | 32.8 | 153.2 | High |
| 14 | Tilak Varma | 315 | 31 | 568 | 11.9 | 32.0 | 149.1 | High |
| 15 | Nicholas Pooran | 314 | 31 | 567 | 11.6 | 33.5 | 165.1 | High |
| 16 | Rishabh Pant | 308 | 29 | 556 | 11.3 | 32.2 | 139.0 | High |
| 17 | Ruturaj Gaikwad | 300 | 27 | 543 | 9.7 | 36.3 | 136.0 | Medium |
| 18 | Devdutt Padikkal | 288 | 25 | 523 | 10.3 | 31.0 | 159.5 | Low |
| 19 | Rohit Sharma | 247 | 16 | 453 | 8.2 | 34.0 | 151.8 | Medium |
| 20 | Tim David | 195 | 4 | 364 | 10.3 | 38.2 | 176.8 | Medium |
Lower/Upper = 80% prediction interval for total runs (split-conformal around the point estimate, calibrated on 2014–2025 out-of-sample errors; see C). Expected average = expected runs ÷ expected dismissals; expected strike rate = recency-weighted, shrunk SR. Confidence: High = regular (batted in ≥70% of team matches) in each of the last 3 seasons, Medium = 2 of 3, Low = otherwise. Confidence is relative: even High carries an interval of several hundred runs.
Intervals are calibrated separately for predictions below 150, 150–350 and above 350 runs, so they jump at those boundaries (e.g. 361 → lower bound 120 vs 344 → 37): the 150–350 band historically contains many players who lost their place, so its downside is larger.
Scenarios (runs)
Same runs-per-innings estimate under fixed playing time; strong/weak form = 90th/10th percentile of the historical ratio of actual to predicted runs per innings for established batters (×1.42 / ×0.62).
| Batter | Model expectation | Full season (14 inn) | Full + strong form | Full + weak form | Reduced (8 inn) |
|---|---|---|---|---|---|
| Sai Sudharsan | 572 | 561 | 794 | 349 | 320 |
| Abhishek Sharma | 541 | 517 | 733 | 322 | 296 |
| Virat Kohli | 515 | 535 | 757 | 333 | 305 |
| Shubman Gill | 501 | 535 | 758 | 333 | 306 |
| Heinrich Klaasen | 487 | 466 | 659 | 290 | 266 |
| Yashasvi Jaiswal | 464 | 496 | 703 | 309 | 284 |
| Shreyas Iyer | 421 | 443 | 627 | 276 | 253 |
| Travis Head | 418 | 461 | 653 | 287 | 263 |
| Phil Salt | 413 | 503 | 712 | 313 | 287 |
| Sanju Samson | 392 | 467 | 662 | 291 | 267 |
| Rajat Patidar | 361 | 407 | 576 | 253 | 232 |
| Suryakumar Yadav | 344 | 407 | 576 | 253 | 233 |
| Riyan Parag | 336 | 389 | 551 | 242 | 222 |
| Tilak Varma | 315 | 371 | 525 | 231 | 212 |
| Nicholas Pooran | 314 | 379 | 537 | 236 | 217 |
| Rishabh Pant | 308 | 383 | 542 | 238 | 219 |
| Ruturaj Gaikwad | 300 | 434 | 615 | 271 | 248 |
| Devdutt Padikkal | 288 | 390 | 553 | 243 | 223 |
| Rohit Sharma | 247 | 424 | 600 | 264 | 242 |
| Tim David | 195 | 264 | 373 | 164 | 151 |
B. Individual player analysis
Splits are for 2024–2026; benchmark = all batters at positions 1–4 in those seasons (SR: pace 160, spin 151, powerplay 153, middle 154, death 190). Strengths/risks are produced by fixed rules (±15 SR points with ≥60 balls, missed seasons, CV > 0.3, low recent share, role).
1. Sai Sudharsan (B Sai Sudharsan)
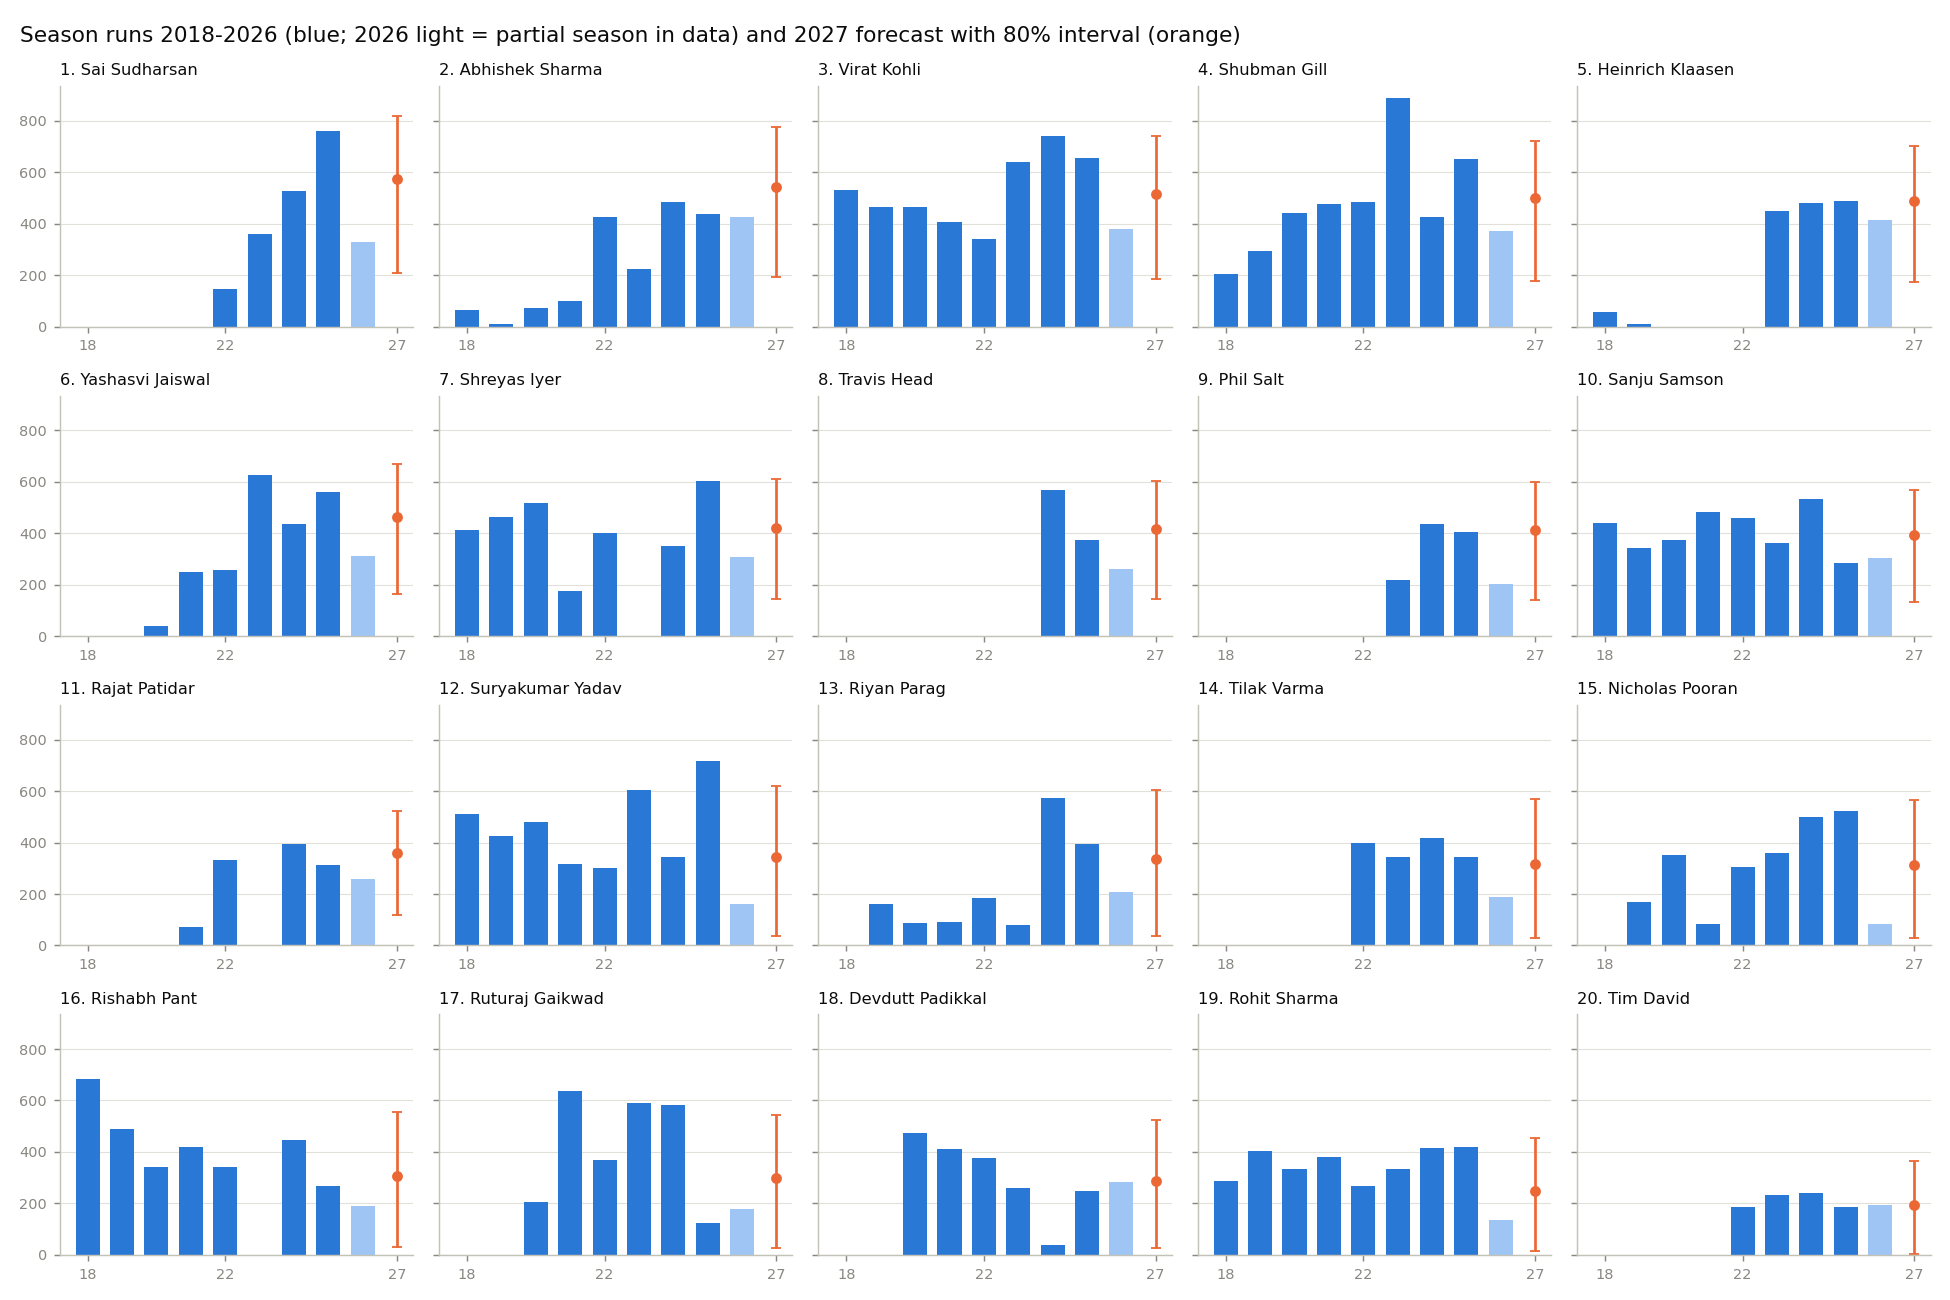
- Historical trend: 2022: 145 (5 inn), 2023: 362 (8 inn), 2024: 527 (12 inn), 2025: 759 (15 inn), 2026: 328 (9 inn). Teams in data: GT.
- Recent performance: 2026 (partial, to data cutoff): 328 runs in 9 innings, SR 162; last 10 innings: 408 runs, SR 163.
- Strengths (data-derived): strike rate 207 vs death (top-order benchmark 190, 61 balls); high recent runs per innings (weighted, shrunk: 42.8); frequent 50+ scores (35% of innings, weighted).
- Risk factors: none flagged by the rules beyond general IPL variance.
- 2027 estimate: 572 runs (80% interval 207–820) from 14.3 expected innings × 40.1 runs/innings; confidence High.
- Scenarios: full season (14 inn) 561; strong form 794; weak form 349; reduced time (8 inn) 320.
- Assumptions: plays IPL 2027 with availability in line with the player's own recent history; role similar to 2024–2026; 2027 team, squad and batting position not known from the data.
2. Abhishek Sharma (Abhishek Sharma)
- Historical trend: 2020: 71 (7 inn), 2021: 98 (7 inn), 2022: 426 (14 inn), 2023: 226 (11 inn), 2024: 484 (16 inn), 2025: 439 (13 inn), 2026: 425 (9 inn). Teams in data: DC → SRH.
- Recent performance: 2026 (partial, to data cutoff): 425 runs in 9 innings, SR 209; last 10 innings: 457 runs, SR 209.
- Strengths (data-derived): strike rate 185 vs pace (top-order benchmark 160, 466 balls); strike rate 241 vs spin (top-order benchmark 151, 201 balls); strike rate 200 vs powerplay (top-order benchmark 153, 437 balls); strike rate 214 vs middle (top-order benchmark 154, 206 balls); high recent runs per innings (weighted, shrunk: 35.7); frequent 50+ scores (27% of innings, weighted).
- Risk factors: none flagged by the rules beyond general IPL variance.
- 2027 estimate: 541 runs (80% interval 194–777) from 14.7 expected innings × 37.0 runs/innings; confidence High.
- Scenarios: full season (14 inn) 517; strong form 733; weak form 322; reduced time (8 inn) 296.
- Assumptions: plays IPL 2027 with availability in line with the player's own recent history; role similar to 2024–2026; 2027 team, squad and batting position not known from the data.
3. Virat Kohli (V Kohli)
- Historical trend: 2020: 466 (15 inn), 2021: 405 (15 inn), 2022: 341 (16 inn), 2023: 639 (14 inn), 2024: 741 (15 inn), 2025: 657 (15 inn), 2026: 379 (9 inn). Teams in data: RCB.
- Recent performance: 2026 (partial, to data cutoff): 379 runs in 9 innings, SR 166; last 10 innings: 422 runs, SR 160.
- Strengths (data-derived): high recent runs per innings (weighted, shrunk: 43.4); frequent 50+ scores (41% of innings, weighted).
- Risk factors: strike rate 134 vs spin (benchmark 151, 464 balls); strike rate 137 vs middle (benchmark 154, 518 balls); volatile season-to-season output (runs-per-innings CV 0.36 over 18 seasons).
- 2027 estimate: 515 runs (80% interval 183–741) from 13.5 expected innings × 38.2 runs/innings; confidence High.
- Scenarios: full season (14 inn) 535; strong form 757; weak form 333; reduced time (8 inn) 305.
- Assumptions: plays IPL 2027 with availability in line with the player's own recent history; role similar to 2024–2026; 2027 team, squad and batting position not known from the data.
4. Shubman Gill (Shubman Gill)
- Historical trend: 2020: 440 (14 inn), 2021: 478 (17 inn), 2022: 483 (16 inn), 2023: 890 (17 inn), 2024: 426 (12 inn), 2025: 650 (15 inn), 2026: 373 (8 inn). Teams in data: KKR → GT.
- Recent performance: 2026 (partial, to data cutoff): 373 runs in 8 innings, SR 155; last 10 innings: 387 runs, SR 154.
- Strengths (data-derived): high recent runs per innings (weighted, shrunk: 40.7); frequent 50+ scores (34% of innings, weighted).
- Risk factors: volatile season-to-season output (runs-per-innings CV 0.33 over 8 seasons).
- 2027 estimate: 501 runs (80% interval 177–720) from 13.1 expected innings × 38.2 runs/innings; confidence High.
- Scenarios: full season (14 inn) 535; strong form 758; weak form 333; reduced time (8 inn) 306.
- Assumptions: plays IPL 2027 with availability in line with the player's own recent history; role similar to 2024–2026; 2027 team, squad and batting position not known from the data.
5. Heinrich Klaasen (H Klaasen)
- Historical trend: 2023: 448 (11 inn), 2024: 479 (15 inn), 2025: 487 (13 inn), 2026: 414 (9 inn). Teams in data: RR → RCB → SRH.
- Recent performance: 2026 (partial, to data cutoff): 414 runs in 9 innings, SR 157; last 10 innings: 519 runs, SR 172.
- Strengths (data-derived): strike rate 176 vs spin (top-order benchmark 151, 346 balls); high recent runs per innings (weighted, shrunk: 37.2); frequent 50+ scores (27% of innings, weighted).
- Risk factors: no IPL innings in 2020, 2021, 2022 (availability/selection history); middle/lower-order role (weighted batting position 4.6) caps balls per innings.
- 2027 estimate: 487 runs (80% interval 172–702) from 14.7 expected innings × 33.3 runs/innings; confidence High.
- Scenarios: full season (14 inn) 466; strong form 659; weak form 290; reduced time (8 inn) 266.
- Assumptions: plays IPL 2027 with availability in line with the player's own recent history; role similar to 2024–2026; 2027 team, squad and batting position not known from the data.
6. Yashasvi Jaiswal (YBK Jaiswal)
- Historical trend: 2020: 40 (3 inn), 2021: 249 (10 inn), 2022: 258 (10 inn), 2023: 625 (14 inn), 2024: 435 (15 inn), 2025: 559 (14 inn), 2026: 312 (10 inn). Teams in data: RR.
- Recent performance: 2026 (partial, to data cutoff): 312 runs in 10 innings, SR 159; last 10 innings: 312 runs, SR 159.
- Strengths (data-derived): frequent 50+ scores (29% of innings, weighted).
- Risk factors: strike rate 135 vs spin (benchmark 151, 218 balls).
- 2027 estimate: 464 runs (80% interval 162–670) from 13.1 expected innings × 35.5 runs/innings; confidence High.
- Scenarios: full season (14 inn) 496; strong form 703; weak form 309; reduced time (8 inn) 284.
- Assumptions: plays IPL 2027 with availability in line with the player's own recent history; role similar to 2024–2026; 2027 team, squad and batting position not known from the data.
7. Shreyas Iyer (SS Iyer)
- Historical trend: 2020: 519 (17 inn), 2021: 175 (8 inn), 2022: 401 (14 inn), 2024: 351 (14 inn), 2025: 604 (17 inn), 2026: 309 (7 inn). Teams in data: DC → KKR → PBKS.
- Recent performance: 2026 (partial, to data cutoff): 309 runs in 7 innings, SR 175; last 10 innings: 399 runs, SR 179.
- Strengths (data-derived): strike rate 214 vs death (top-order benchmark 190, 185 balls); frequent 50+ scores (33% of innings, weighted).
- Risk factors: strike rate 128 vs powerplay (benchmark 153, 101 balls); no IPL innings in 2023 (availability/selection history).
- 2027 estimate: 421 runs (80% interval 145–610) from 13.3 expected innings × 31.6 runs/innings; confidence High.
- Scenarios: full season (14 inn) 443; strong form 627; weak form 276; reduced time (8 inn) 253.
- Assumptions: plays IPL 2027 with availability in line with the player's own recent history; role similar to 2024–2026; 2027 team, squad and batting position not known from the data.
8. Travis Head (TM Head)
- Historical trend: 2024: 567 (15 inn), 2025: 374 (12 inn), 2026: 262 (9 inn). Teams in data: RCB → SRH.
- Recent performance: 2026 (partial, to data cutoff): 262 runs in 9 innings, SR 164; last 10 innings: 338 runs, SR 169.
- Strengths (data-derived): strike rate 185 vs pace (top-order benchmark 160, 475 balls); strike rate 181 vs powerplay (top-order benchmark 153, 482 balls).
- Risk factors: no IPL innings in 2020, 2021, 2022, 2023 (availability/selection history).
- 2027 estimate: 418 runs (80% interval 143–604) from 12.7 expected innings × 32.9 runs/innings; confidence High.
- Scenarios: full season (14 inn) 461; strong form 653; weak form 287; reduced time (8 inn) 263.
- Assumptions: plays IPL 2027 with availability in line with the player's own recent history; role similar to 2024–2026; 2027 team, squad and batting position not known from the data.
9. Phil Salt (PD Salt)
- Historical trend: 2023: 218 (9 inn), 2024: 435 (12 inn), 2025: 403 (13 inn), 2026: 202 (6 inn). Teams in data: DC → KKR → RCB.
- Recent performance: 2026 (partial, to data cutoff): 202 runs in 6 innings, SR 168; last 10 innings: 366 runs, SR 177.
- Strengths (data-derived): strike rate 191 vs spin (top-order benchmark 151, 137 balls); strike rate 176 vs powerplay (top-order benchmark 153, 417 balls); strike rate 180 vs middle (top-order benchmark 154, 168 balls); frequent 50+ scores (31% of innings, weighted).
- Risk factors: batted in only 67% of the team's 2026 matches in the data.
- 2027 estimate: 413 runs (80% interval 141–598) from 11.5 expected innings × 35.9 runs/innings; confidence Medium.
- Scenarios: full season (14 inn) 503; strong form 712; weak form 313; reduced time (8 inn) 287.
- Assumptions: plays IPL 2027 with availability in line with the player's own recent history; role similar to 2024–2026; 2027 team, squad and batting position not known from the data.
10. Sanju Samson (SV Samson)
- Historical trend: 2020: 375 (14 inn), 2021: 484 (14 inn), 2022: 458 (17 inn), 2023: 362 (14 inn), 2024: 531 (15 inn), 2025: 285 (9 inn), 2026: 304 (8 inn). Teams in data: RR → DC → RR → CSK.
- Recent performance: 2026 (partial, to data cutoff): 304 runs in 8 innings, SR 170; last 10 innings: 365 runs, SR 162.
- Strengths (data-derived): no split stands out by ≥15 SR points from the benchmark.
- Risk factors: none flagged by the rules beyond general IPL variance.
- 2027 estimate: 392 runs (80% interval 133–569) from 11.8 expected innings × 33.4 runs/innings; confidence Medium.
- Scenarios: full season (14 inn) 467; strong form 662; weak form 291; reduced time (8 inn) 267.
- Assumptions: plays IPL 2027 with availability in line with the player's own recent history; role similar to 2024–2026; 2027 team, squad and batting position not known from the data.
11. Rajat Patidar (RM Patidar)
- Historical trend: 2021: 71 (4 inn), 2022: 333 (7 inn), 2024: 395 (13 inn), 2025: 312 (14 inn), 2026: 257 (8 inn). Teams in data: RCB.
- Recent performance: 2026 (partial, to data cutoff): 257 runs in 8 innings, SR 201; last 10 innings: 298 runs, SR 196.
- Strengths (data-derived): strike rate 178 vs spin (top-order benchmark 151, 233 balls); strike rate 179 vs middle (top-order benchmark 154, 404 balls).
- Risk factors: strike rate 126 vs powerplay (benchmark 153, 89 balls); strike rate 169 vs death (benchmark 190, 75 balls); no IPL innings in 2023 (availability/selection history).
- 2027 estimate: 361 runs (80% interval 120–524) from 12.4 expected innings × 29.0 runs/innings; confidence High.
- Scenarios: full season (14 inn) 407; strong form 576; weak form 253; reduced time (8 inn) 232.
- Assumptions: plays IPL 2027 with availability in line with the player's own recent history; role similar to 2024–2026; 2027 team, squad and batting position not known from the data.
12. Suryakumar Yadav (SA Yadav)
- Historical trend: 2020: 480 (15 inn), 2021: 317 (14 inn), 2022: 303 (8 inn), 2023: 605 (16 inn), 2024: 345 (11 inn), 2025: 717 (16 inn), 2026: 162 (8 inn). Teams in data: MI → KKR → MI.
- Recent performance: 2026 (partial, to data cutoff): 162 runs in 8 innings, SR 141; last 10 innings: 239 runs, SR 148.
- Strengths (data-derived): strike rate 207 vs death (top-order benchmark 190, 81 balls); frequent 50+ scores (26% of innings, weighted).
- Risk factors: volatile season-to-season output (runs-per-innings CV 0.37 over 11 seasons).
- 2027 estimate: 344 runs (80% interval 37–618) from 11.8 expected innings × 29.1 runs/innings; confidence High.
- Scenarios: full season (14 inn) 407; strong form 576; weak form 253; reduced time (8 inn) 233.
- Assumptions: plays IPL 2027 with availability in line with the player's own recent history; role similar to 2024–2026; 2027 team, squad and batting position not known from the data.
13. Riyan Parag (R Parag)
- Historical trend: 2020: 86 (8 inn), 2021: 93 (10 inn), 2022: 183 (14 inn), 2023: 78 (7 inn), 2024: 573 (14 inn), 2025: 393 (14 inn), 2026: 207 (10 inn). Teams in data: RR.
- Recent performance: 2026 (partial, to data cutoff): 207 runs in 10 innings, SR 144; last 10 innings: 207 runs, SR 144.
- Strengths (data-derived): no split stands out by ≥15 SR points from the benchmark.
- Risk factors: volatile season-to-season output (runs-per-innings CV 0.67 over 5 seasons).
- 2027 estimate: 336 runs (80% interval 35–603) from 12.1 expected innings × 27.8 runs/innings; confidence High.
- Scenarios: full season (14 inn) 389; strong form 551; weak form 242; reduced time (8 inn) 222.
- Assumptions: plays IPL 2027 with availability in line with the player's own recent history; role similar to 2024–2026; 2027 team, squad and batting position not known from the data.
14. Tilak Varma (Tilak Varma)
- Historical trend: 2022: 397 (14 inn), 2023: 343 (11 inn), 2024: 416 (13 inn), 2025: 343 (13 inn), 2026: 188 (8 inn). Teams in data: MI.
- Recent performance: 2026 (partial, to data cutoff): 188 runs in 8 innings, SR 169; last 10 innings: 257 runs, SR 170.
- Strengths (data-derived): strike rate 206 vs death (top-order benchmark 190, 127 balls).
- Risk factors: strike rate 107 vs powerplay (benchmark 153, 100 balls); middle/lower-order role (weighted batting position 4.6) caps balls per innings.
- 2027 estimate: 315 runs (80% interval 31–568) from 11.9 expected innings × 26.5 runs/innings; confidence High.
- Scenarios: full season (14 inn) 371; strong form 525; weak form 231; reduced time (8 inn) 212.
- Assumptions: plays IPL 2027 with availability in line with the player's own recent history; role similar to 2024–2026; 2027 team, squad and batting position not known from the data.
15. Nicholas Pooran (N Pooran)
- Historical trend: 2020: 353 (14 inn), 2021: 85 (11 inn), 2022: 306 (13 inn), 2023: 358 (15 inn), 2024: 499 (14 inn), 2025: 524 (14 inn), 2026: 82 (8 inn). Teams in data: PBKS → SRH → LSG.
- Recent performance: 2026 (partial, to data cutoff): 82 runs in 8 innings, SR 81; last 10 innings: 151 runs, SR 109.
- Strengths (data-derived): strike rate 190 vs spin (top-order benchmark 151, 224 balls).
- Risk factors: volatile season-to-season output (runs-per-innings CV 0.42 over 6 seasons).
- 2027 estimate: 314 runs (80% interval 31–567) from 11.6 expected innings × 27.1 runs/innings; confidence High.
- Scenarios: full season (14 inn) 379; strong form 537; weak form 236; reduced time (8 inn) 217.
- Assumptions: plays IPL 2027 with availability in line with the player's own recent history; role similar to 2024–2026; 2027 team, squad and batting position not known from the data.
16. Rishabh Pant (RR Pant)
- Historical trend: 2020: 343 (14 inn), 2021: 419 (16 inn), 2022: 340 (13 inn), 2024: 446 (13 inn), 2025: 269 (13 inn), 2026: 189 (8 inn). Teams in data: DC → LSG.
- Recent performance: 2026 (partial, to data cutoff): 189 runs in 8 innings, SR 127; last 10 innings: 323 runs, SR 150.
- Strengths (data-derived): no split stands out by ≥15 SR points from the benchmark.
- Risk factors: strike rate 120 vs spin (benchmark 151, 232 balls); strike rate 102 vs powerplay (benchmark 153, 123 balls); strike rate 136 vs middle (benchmark 154, 394 balls); no IPL innings in 2023 (availability/selection history); volatile season-to-season output (runs-per-innings CV 0.31 over 9 seasons).
- 2027 estimate: 308 runs (80% interval 29–556) from 11.3 expected innings × 27.3 runs/innings; confidence High.
- Scenarios: full season (14 inn) 383; strong form 542; weak form 238; reduced time (8 inn) 219.
- Assumptions: plays IPL 2027 with availability in line with the player's own recent history; role similar to 2024–2026; 2027 team, squad and batting position not known from the data.
17. Ruturaj Gaikwad (RD Gaikwad)
- Historical trend: 2020: 204 (6 inn), 2021: 635 (16 inn), 2022: 368 (14 inn), 2023: 590 (15 inn), 2024: 583 (14 inn), 2025: 122 (5 inn), 2026: 178 (8 inn). Teams in data: CSK.
- Recent performance: 2026 (partial, to data cutoff): 178 runs in 8 innings, SR 121; last 10 innings: 184 runs, SR 119.
- Strengths (data-derived): frequent 50+ scores (26% of innings, weighted).
- Risk factors: strike rate 140 vs pace (benchmark 160, 448 balls); strike rate 132 vs spin (benchmark 151, 193 balls); strike rate 136 vs powerplay (benchmark 153, 316 balls); strike rate 129 vs middle (benchmark 154, 265 balls).
- 2027 estimate: 300 runs (80% interval 27–543) from 9.7 expected innings × 31.0 runs/innings; confidence Medium.
- Scenarios: full season (14 inn) 434; strong form 615; weak form 271; reduced time (8 inn) 248.
- Assumptions: plays IPL 2027 with availability in line with the player's own recent history; role similar to 2024–2026; 2027 team, squad and batting position not known from the data.
18. Devdutt Padikkal (D Padikkal)
- Historical trend: 2020: 473 (15 inn), 2021: 411 (14 inn), 2022: 376 (17 inn), 2023: 261 (11 inn), 2024: 38 (7 inn), 2025: 247 (10 inn), 2026: 282 (8 inn). Teams in data: RCB → RR → LSG → RCB.
- Recent performance: 2026 (partial, to data cutoff): 282 runs in 8 innings, SR 188; last 10 innings: 299 runs, SR 179.
- Strengths (data-derived): no split stands out by ≥15 SR points from the benchmark.
- Risk factors: strike rate 126 vs spin (benchmark 151, 144 balls).
- 2027 estimate: 288 runs (80% interval 25–523) from 10.3 expected innings × 27.9 runs/innings; confidence Low.
- Scenarios: full season (14 inn) 390; strong form 553; weak form 243; reduced time (8 inn) 223.
- Assumptions: plays IPL 2027 with availability in line with the player's own recent history; role similar to 2024–2026; 2027 team, squad and batting position not known from the data.
19. Rohit Sharma (RG Sharma)
- Historical trend: 2020: 332 (12 inn), 2021: 381 (13 inn), 2022: 268 (14 inn), 2023: 332 (16 inn), 2024: 417 (14 inn), 2025: 418 (15 inn), 2026: 137 (4 inn). Teams in data: SRH → MI.
- Recent performance: 2026 (partial, to data cutoff): 137 runs in 4 innings, SR 165; last 10 innings: 315 runs, SR 150.
- Strengths (data-derived): no split stands out by ≥15 SR points from the benchmark.
- Risk factors: batted in only 50% of the team's 2026 matches in the data.
- 2027 estimate: 247 runs (80% interval 16–453) from 8.2 expected innings × 30.3 runs/innings; confidence Medium.
- Scenarios: full season (14 inn) 424; strong form 600; weak form 264; reduced time (8 inn) 242.
- Assumptions: plays IPL 2027 with availability in line with the player's own recent history; role similar to 2024–2026; 2027 team, squad and batting position not known from the data.
20. Tim David (TH David)
- Historical trend: 2021: 1 (1 inn), 2022: 186 (8 inn), 2023: 231 (15 inn), 2024: 241 (11 inn), 2025: 187 (9 inn), 2026: 192 (8 inn). Teams in data: RCB → MI → RCB.
- Recent performance: 2026 (partial, to data cutoff): 192 runs in 8 innings, SR 192; last 10 innings: 195 runs, SR 181.
- Strengths (data-derived): strike rate 183 vs pace (top-order benchmark 160, 270 balls).
- Risk factors: strike rate 138 vs middle (benchmark 154, 121 balls); middle/lower-order role (weighted batting position 6.3) caps balls per innings.
- 2027 estimate: 195 runs (80% interval 4–364) from 10.3 expected innings × 18.8 runs/innings; confidence Medium.
- Scenarios: full season (14 inn) 264; strong form 373; weak form 164; reduced time (8 inn) 151.
- Assumptions: plays IPL 2027 with availability in line with the player's own recent history; role similar to 2024–2026; 2027 team, squad and batting position not known from the data.
C. Model evaluation
Dataset and name matching
-
Ball-by-ball data, 2008–2026: 288,051 deliveries (super overs excluded), 18,639 player innings, 732 batters. Runs, balls, boundaries, dismissals, batting position and phase come from deliveries; bowler type is used to group deliveries into pace or spin.
-
Missing: batsman type on 239 deliveries, bowler type on 339 (counted as pace). Matches abandoned without a ball are absent. 'Innings' means batted appearances: players in the XI who did not bat cannot be seen.
-
Not in the data: age/date of birth, squads, auction/retention, injuries, 2027 teams and batting orders, non-IPL cricket. Age and career stage are proxied only by years since IPL debut.
-
Names were matched on the players file's full names, never by surname (e.g.
R Sharma= Rahul Sharma,VR Iyer= Venkatesh Iyer). No dataset name batted for two teams in one season, so no different players are merged under one name.
| batter | dataset_name | player_id | full_name | seasons | career_runs | teams |
|---|---|---|---|---|---|---|
| Virat Kohli | V Kohli | 332 | Virat Kohli | 2008–2026 (19) | 9040 | RCB |
| Rohit Sharma | RG Sharma | 25 | Rohit Gurunath Sharma | 2008–2026 (19) | 7183 | SRH → MI |
| Suryakumar Yadav | SA Yadav | 61 | Suryakumar Ashok Yadav | 2012–2026 (14) | 4473 | MI → KKR → MI |
| Shubman Gill | Shubman Gill | 1580 | Shubman Gill | 2018–2026 (9) | 4239 | KKR → GT |
| Sai Sudharsan | B Sai Sudharsan | 6999 | Bhardwaj Sai Sudharsan | 2022–2026 (5) | 2121 | GT |
| Yashasvi Jaiswal | YBK Jaiswal | 4104 | Yashasvi Bhupendra Kumar Jaiswal | 2020–2026 (7) | 2478 | RR |
| Riyan Parag | R Parag | 3230 | Riyan Parag | 2019–2026 (8) | 1773 | RR |
| Devdutt Padikkal | D Padikkal | 4071 | Devdutt Padikkal | 2020–2026 (7) | 2088 | RCB → RR → LSG → RCB |
| Tim David | TH David | 6550 | Timothy Hays David | 2021–2026 (6) | 1038 | RCB → MI → RCB |
| Rajat Patidar | RM Patidar | 5349 | Rajat Manohar Patidar | 2021–2026 (5) | 1368 | RCB |
| Ruturaj Gaikwad | RD Gaikwad | 4119 | Ruturaj Dashrat Gaikwad | 2020–2026 (7) | 2680 | CSK |
| Sanju Samson | SV Samson | 180 | Sanju Viswanath Samson | 2013–2026 (14) | 5008 | RR → DC → RR → CSK |
| Abhishek Sharma | Abhishek Sharma | 2349 | Abhishek Sharma | 2018–2026 (9) | 2241 | DC → SRH |
| Travis Head | TM Head | 3 | Travis Michael Head | 2016–2026 (5) | 1408 | RCB → SRH |
| Heinrich Klaasen | H Klaasen | 1740 | Heinrich Klaasen | 2018–2026 (6) | 1894 | RR → RCB → SRH |
| Rishabh Pant | RR Pant | 181 | Rishabh Rajendra Pant | 2016–2026 (10) | 3742 | DC → LSG |
| Nicholas Pooran | N Pooran | 2766 | Nicholas Pooran | 2019–2026 (8) | 2375 | PBKS → SRH → LSG |
| Shreyas Iyer | SS Iyer | 389 | Shreyas Santosh Iyer | 2015–2026 (11) | 4040 | DC → KKR → PBKS |
| Tilak Varma | Tilak Varma | 6681 | Namboori Thakur Tilak Varma | 2022–2026 (5) | 1687 | MI |
| Phil Salt | PD Salt | 8945 | Philip Dean Salt | 2023–2026 (4) | 1258 | DC → KKR → RCB |
Models (rolling origin: train on target seasons 2010…S−1, test on S, S = 2014–2025)
- Baselines: last-season runs; career average runs per season played; Marcel (5/4/3-weighted innings share × matches × shrunk runs/innings).
- Ridge (regularisation chosen by internal CV), RandomForest, gradient boosting (sklearn): direct season runs.
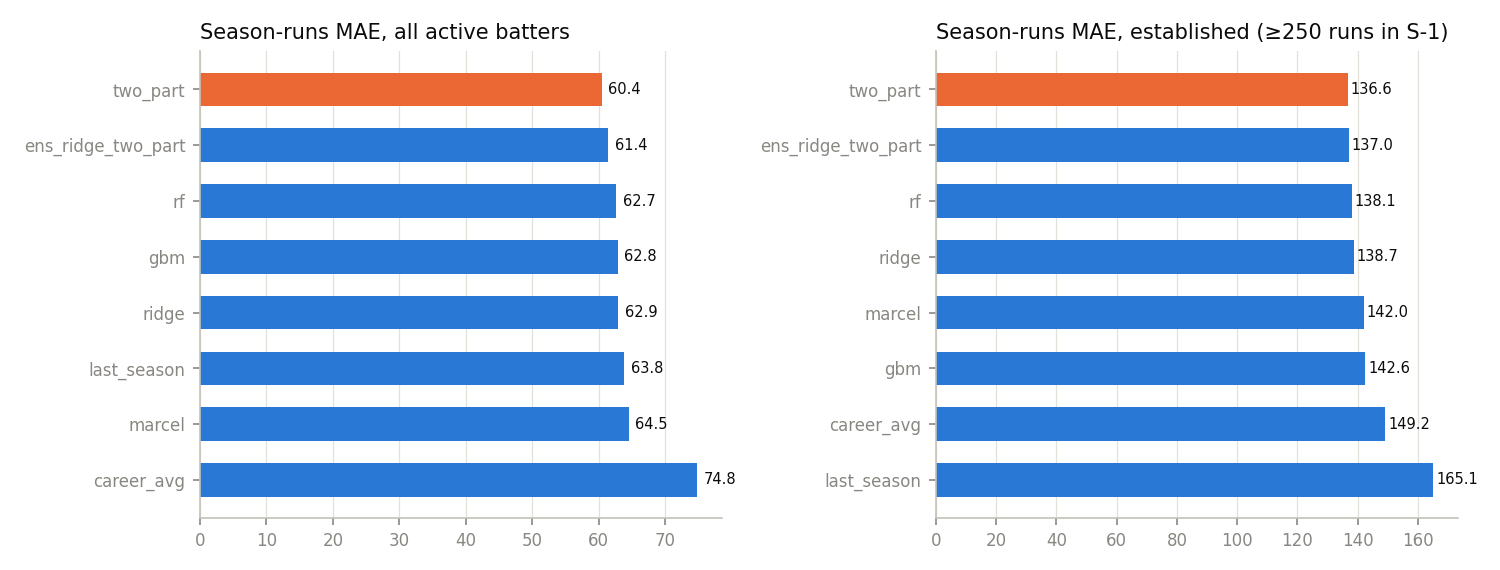
- Two-part ridge (chosen): innings-per-team-match model × runs-per-innings model (the second is innings-weighted and fit only on seasons where the player batted).
- Features (all from seasons < S, rates only): share_1, share_2, share_3, share_w, rpi_w, sr_w, outs_w, bpi_w, pos_w, bnd_w, fifty_w, form10, form_sr10, career_inn, years, played_1, n_inn_w, tm.
- A player-season is in the population if the player batted in S−1 or S−2, and counts as 0 runs when absent in S. That makes availability part of the target.
Backtest: season runs
| subset | model | n | MAE | RMSE | bias |
|---|---|---|---|---|---|
| all active batters | last_season | 2382 | 63.8 | 117.1 | +9.1 |
| all active batters | career_avg | 2382 | 74.8 | 119.2 | +18.5 |
| all active batters | marcel | 2382 | 64.5 | 107.5 | +6.6 |
| all active batters | ridge | 2382 | 62.9 | 103.9 | +5.0 |
| all active batters | rf | 2382 | 62.7 | 104.2 | +2.8 |
| all active batters | gbm | 2382 | 62.8 | 106.2 | +1.5 |
| all active batters | two_part | 2382 | 60.4 | 102.6 | -0.2 |
| all active batters | ens_ridge_two_part | 2382 | 61.4 | 102.8 | +2.4 |
| established (≥250 runs in S-1) | last_season | 393 | 165.1 | 211.2 | +91.5 |
| established (≥250 runs in S-1) | career_avg | 393 | 149.2 | 188.5 | -6.5 |
| established (≥250 runs in S-1) | marcel | 393 | 142.0 | 181.9 | +9.7 |
| established (≥250 runs in S-1) | ridge | 393 | 138.7 | 175.7 | -3.5 |
| established (≥250 runs in S-1) | rf | 393 | 138.1 | 174.9 | -1.5 |
| established (≥250 runs in S-1) | gbm | 393 | 142.6 | 179.6 | +6.4 |
| established (≥250 runs in S-1) | two_part | 393 | 136.6 | 175.2 | -2.5 |
| established (≥250 runs in S-1) | ens_ridge_two_part | 393 | 137.0 | 174.8 | -3.0 |
Paired bootstrap of the MAE difference (negative = two-part better; 95% interval):
| comparison | subset | MAE diff | lo95 | hi95 |
|---|---|---|---|---|
| two_part − last_season | all | -3.4 | -5.6 | -1.2 |
| two_part − marcel | all | -4.1 | -5.3 | -2.9 |
| two_part − ridge | all | -2.5 | -3.3 | -1.8 |
| two_part − rf | all | -2.2 | -3.2 | -1.3 |
| two_part − gbm | all | -2.4 | -3.7 | -1.2 |
| two_part − last_season | established | -28.5 | -39.0 | -19.2 |
| two_part − marcel | established | -5.4 | -10.2 | -0.4 |
| two_part − ridge | established | -2.0 | -4.9 | +0.8 |
| two_part − rf | established | -1.4 | -5.7 | +2.7 |
| two_part − gbm | established | -5.9 | -11.5 | -0.2 |
Backtest: components vs naive baselines
| target | model | MAE |
|---|---|---|
| innings | two-part share model | 2.61 |
| innings | last season innings | 2.71 |
| innings | Marcel weighted share × matches | 2.80 |
| runs/innings (≥5 inn) | two-part rpi model | 5.90 |
| runs/innings (≥5 inn) | last season rpi | 7.57 |
| runs/innings (≥5 inn) | weighted shrunk rpi | 6.31 |
| strike rate (≥100 balls) | weighted shrunk SR | 15.86 |
| strike rate (≥100 balls) | last season SR | 20.09 |
Prediction-interval reliability (nominal 80%)
| method | subset | n | coverage_80 | below_lower | above_upper | mean_width | contains_point |
|---|---|---|---|---|---|---|---|
| conformal around two-part (used) | all | 1937 | 0.809 | 0.084 | 0.107 | 166 | 1.000 |
| conformal around two-part (used) | established | 327 | 0.801 | 0.089 | 0.110 | 469 | 1.000 |
| CQR quantile GBM | all | 1937 | 0.871 | 0.007 | 0.121 | 179 | 0.956 |
| CQR quantile GBM | established | 327 | 0.807 | 0.031 | 0.162 | 441 | 1.000 |
Evaluated on 2016–2025 (each season calibrated only on earlier seasons). The CQR adjustment came out near zero because many rows score exactly 0 runs, and its quantile trees can place the point estimate outside the interval, so the conformal interval around the two-part point is used.
Coverage by season, established batters (conformal interval):
| season | n | coverage_80 |
|---|---|---|
| 2016 | 28 | 0.82 |
| 2017 | 24 | 0.83 |
| 2018 | 35 | 0.69 |
| 2019 | 30 | 0.90 |
| 2020 | 33 | 0.82 |
| 2021 | 33 | 0.88 |
| 2022 | 24 | 0.92 |
| 2023 | 40 | 0.62 |
| 2024 | 41 | 0.83 |
| 2025 | 39 | 0.79 |
Known sources of uncertainty
- The 2026 season is partial in the data, so the most recent evidence is a part-season.
- Playing time is the largest risk: injury, selection, workload, and international clashes are not observable here.
- Team and role changes for 2027 are unknown; batting position is assumed to continue from recent seasons.
- Tournament length is assumed to follow the 2022–26 format (14.7 matches per team on average, including playoffs).
- Seasons are not exchangeable (eras, formats, Impact Player rule), so the conformal coverage guarantee is only approximate.
D. Visualisations